

A new route for surplus stock

Less Inventory. More Cash.

Stop letting excess inventory tie up your cash.
Connect with business buyers, receive offers, and turn surplus stock into working capital.
Private B2B marketplaceIndependently sourced inventory
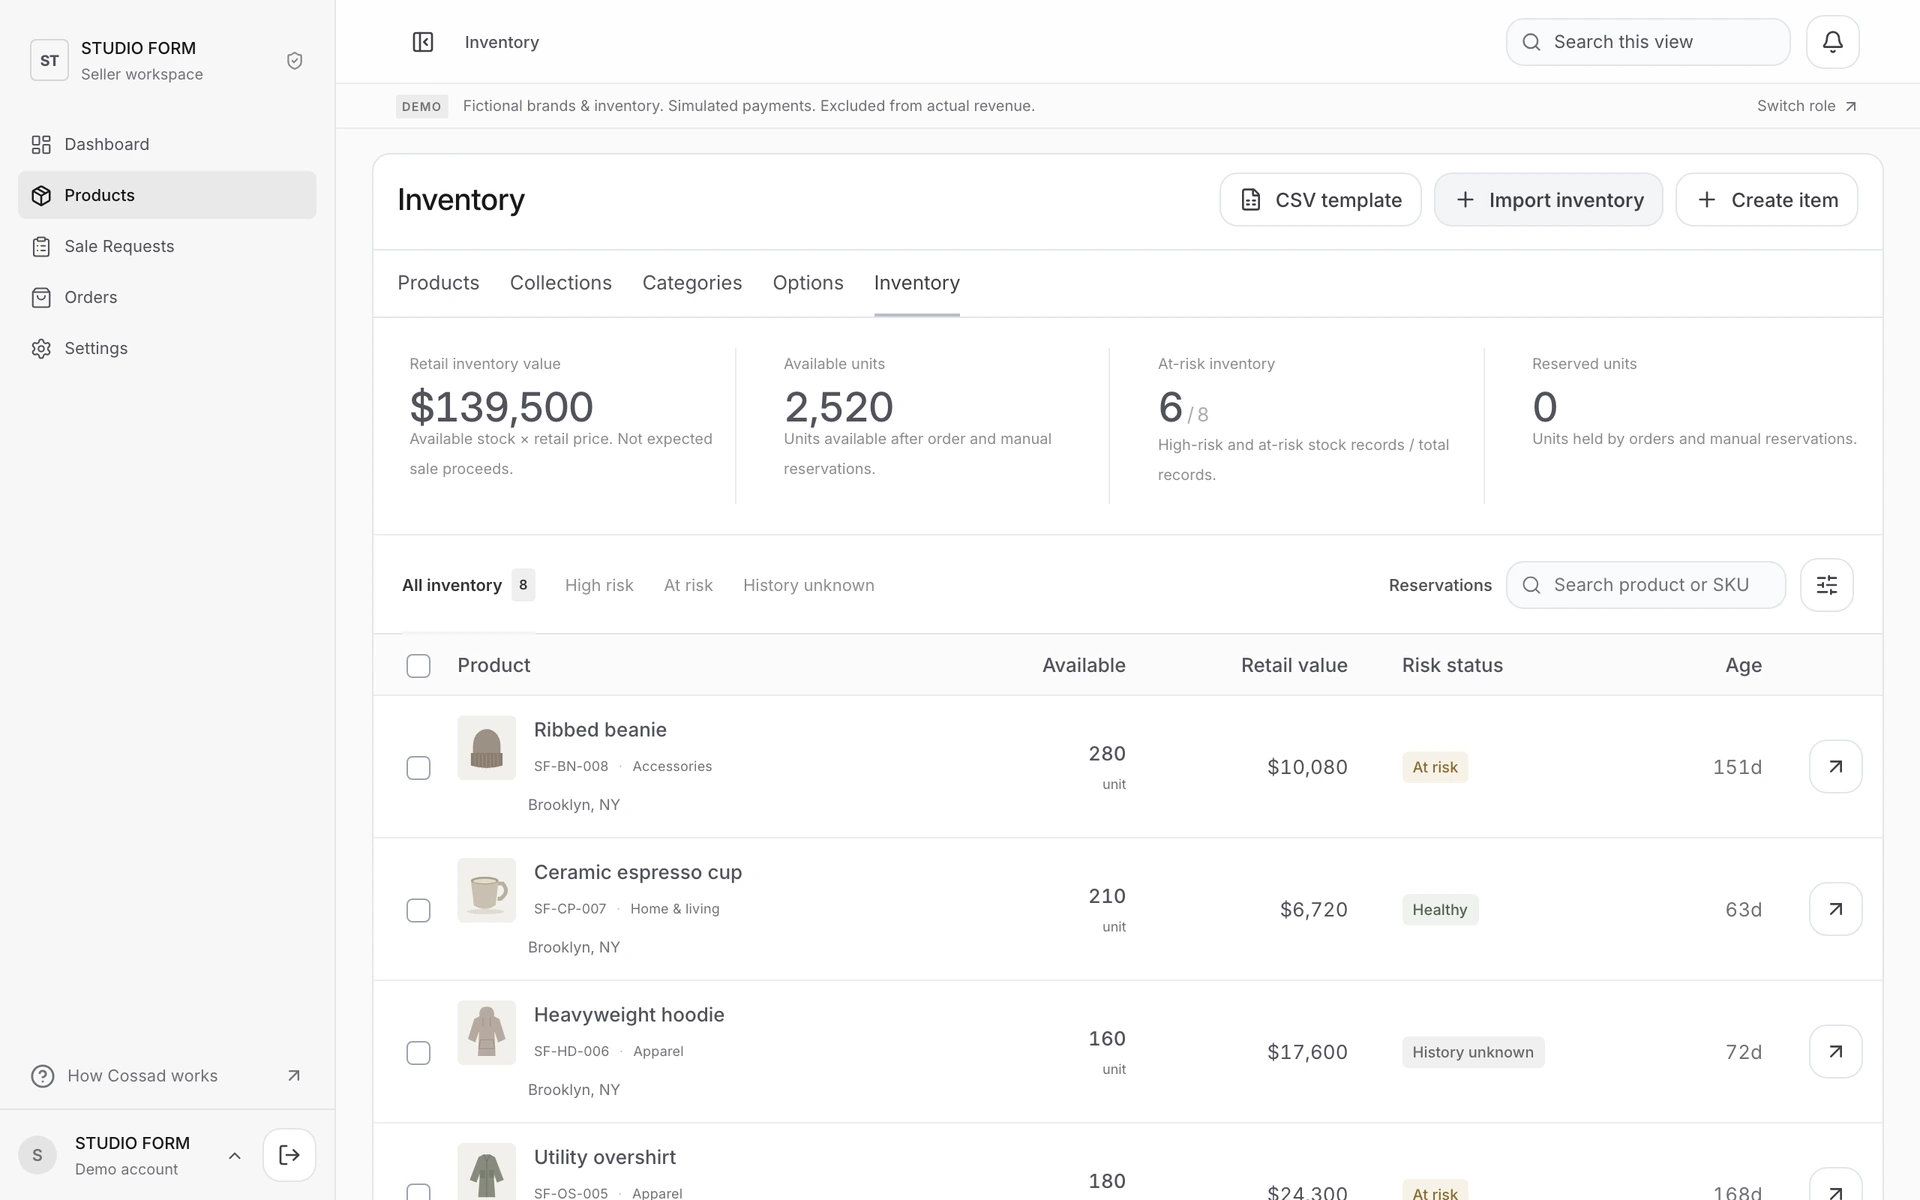
Cossad seller Inventory screen with sample inventory

A better next step for surplus

Make room for what’s next.

Your surplus can be the stock another business needs.

Stacked boxes of surplus inventory
01 / Surplus stock

Unsold stock ties up more than space.

It holds working capital and adds to storage costs. Clear product details and quantities give business buyers what they need to make an offer.

Truck transporting inventory to a buyer
02 / Delivery

Move inventory to its next buyer.

Choose an offer, agree on price and collection terms, then dispatch once payment is confirmed. Keep the handoff connected to the order.

Buyer checking and confirming received goods
03 / Buyer receipt

Goods received. A new chapter begins.

The buyer checks the goods and confirms receipt. Your surplus goes back to work, and a completed sale creates room for your next move.

Your inventory.
Your next move.

Products, stock and buyer offers.
A connected workspace for every step of the sale.
1 / 4
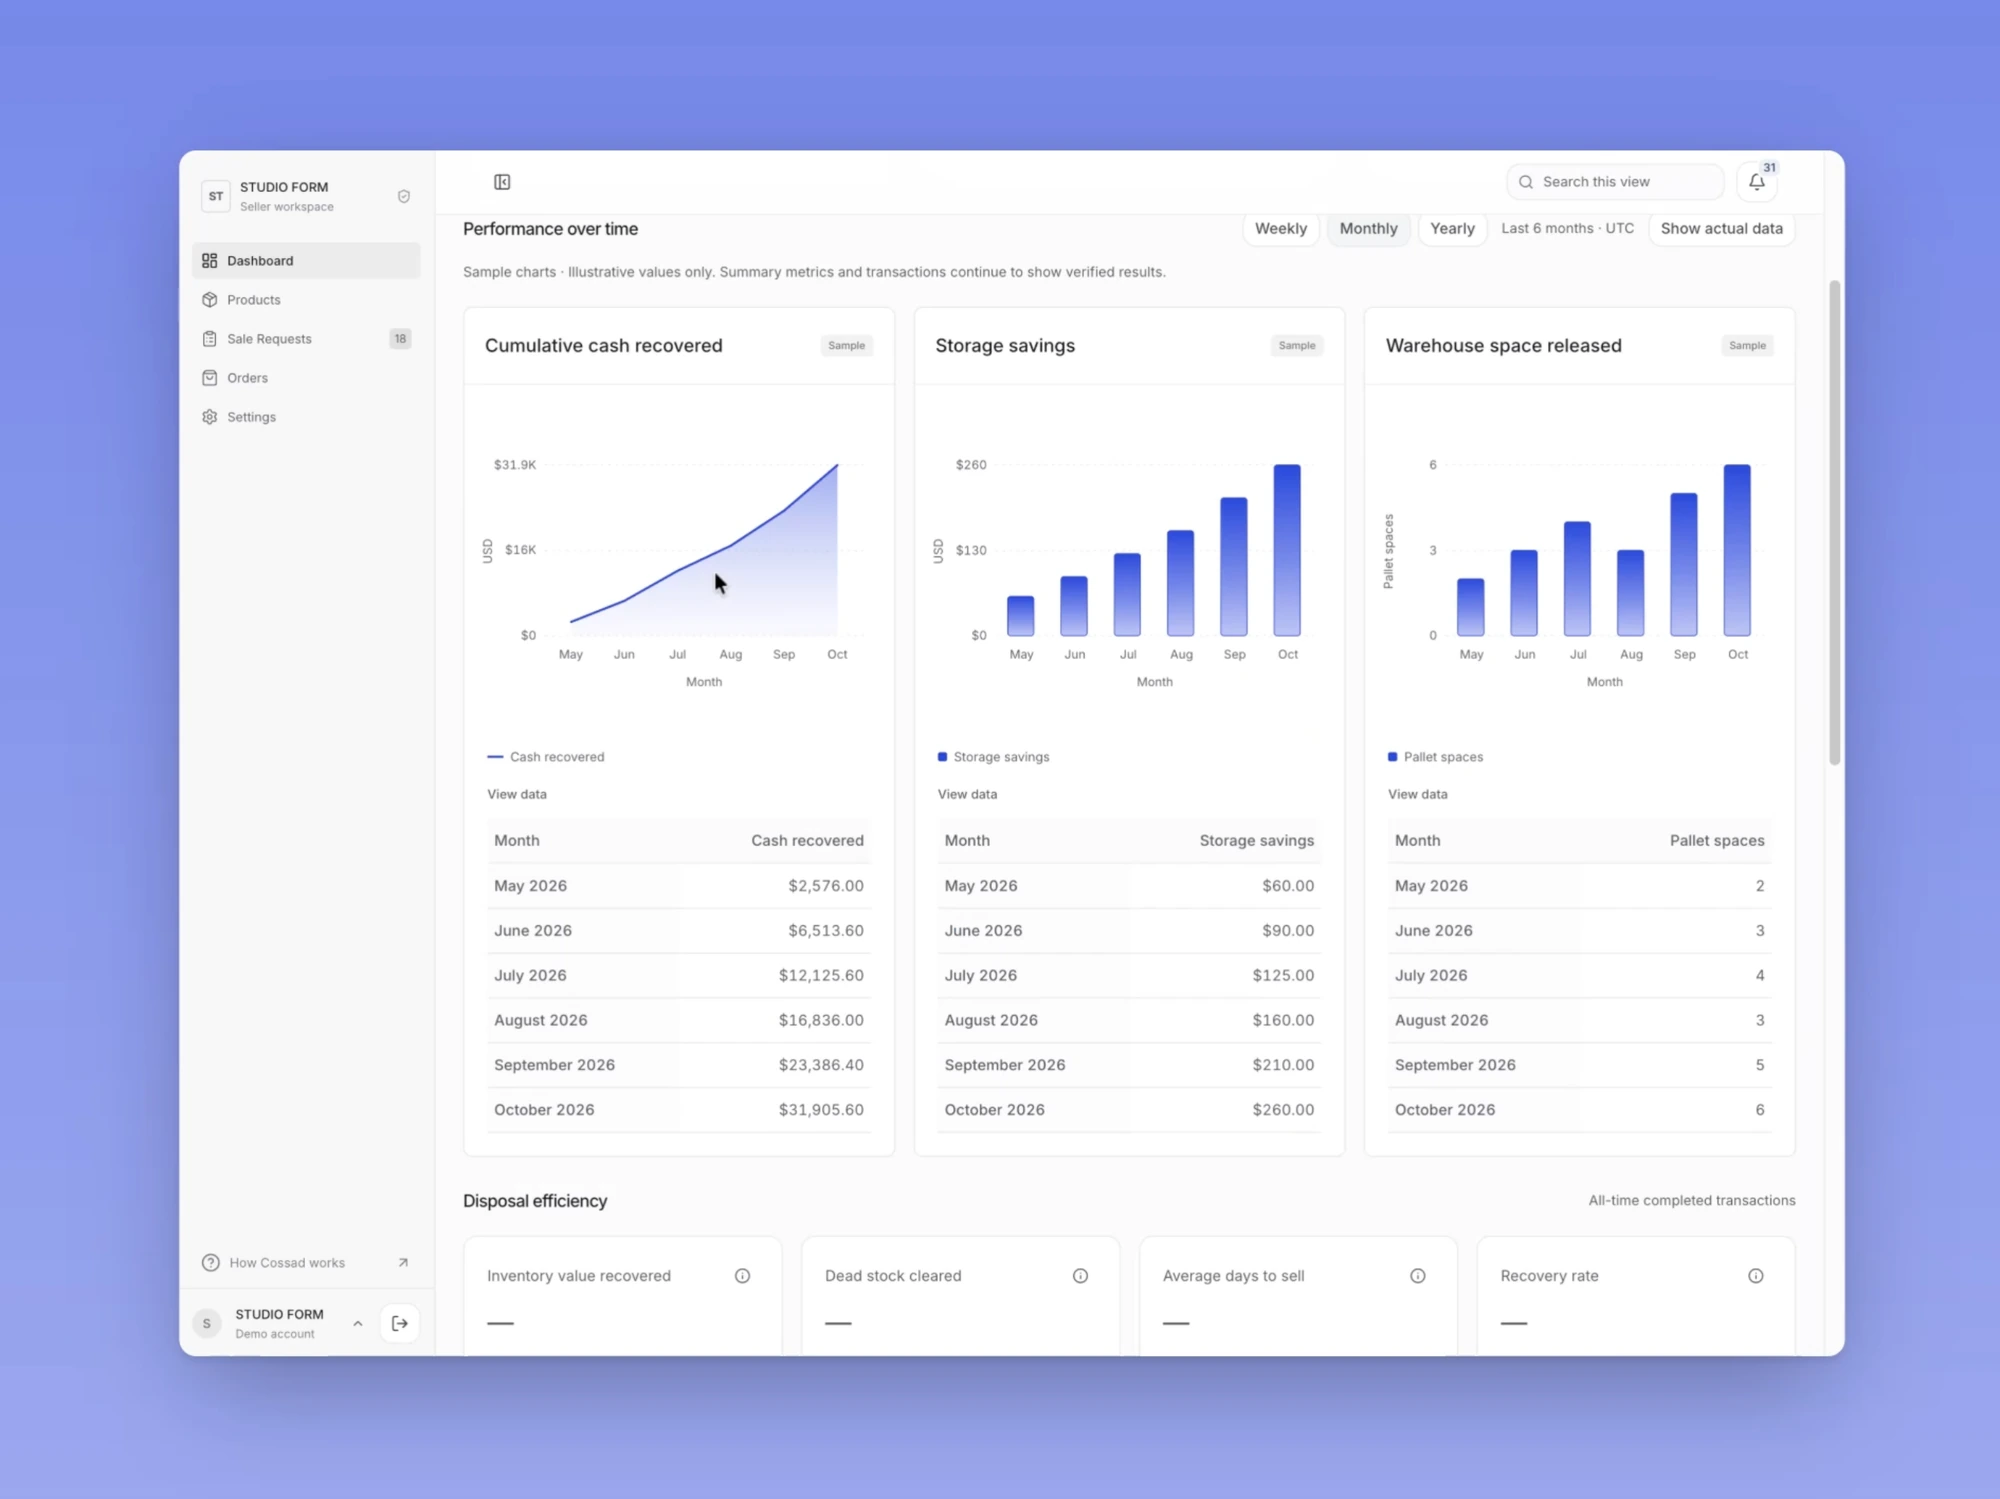
  • Cossad demo seller Dashboard with illustrative recovery, storage savings and warehouse space charts
    01 / Dashboard

    See the bigger picture.

    Review recovery performance over time. This preview shows illustrative charts, not actual business results.
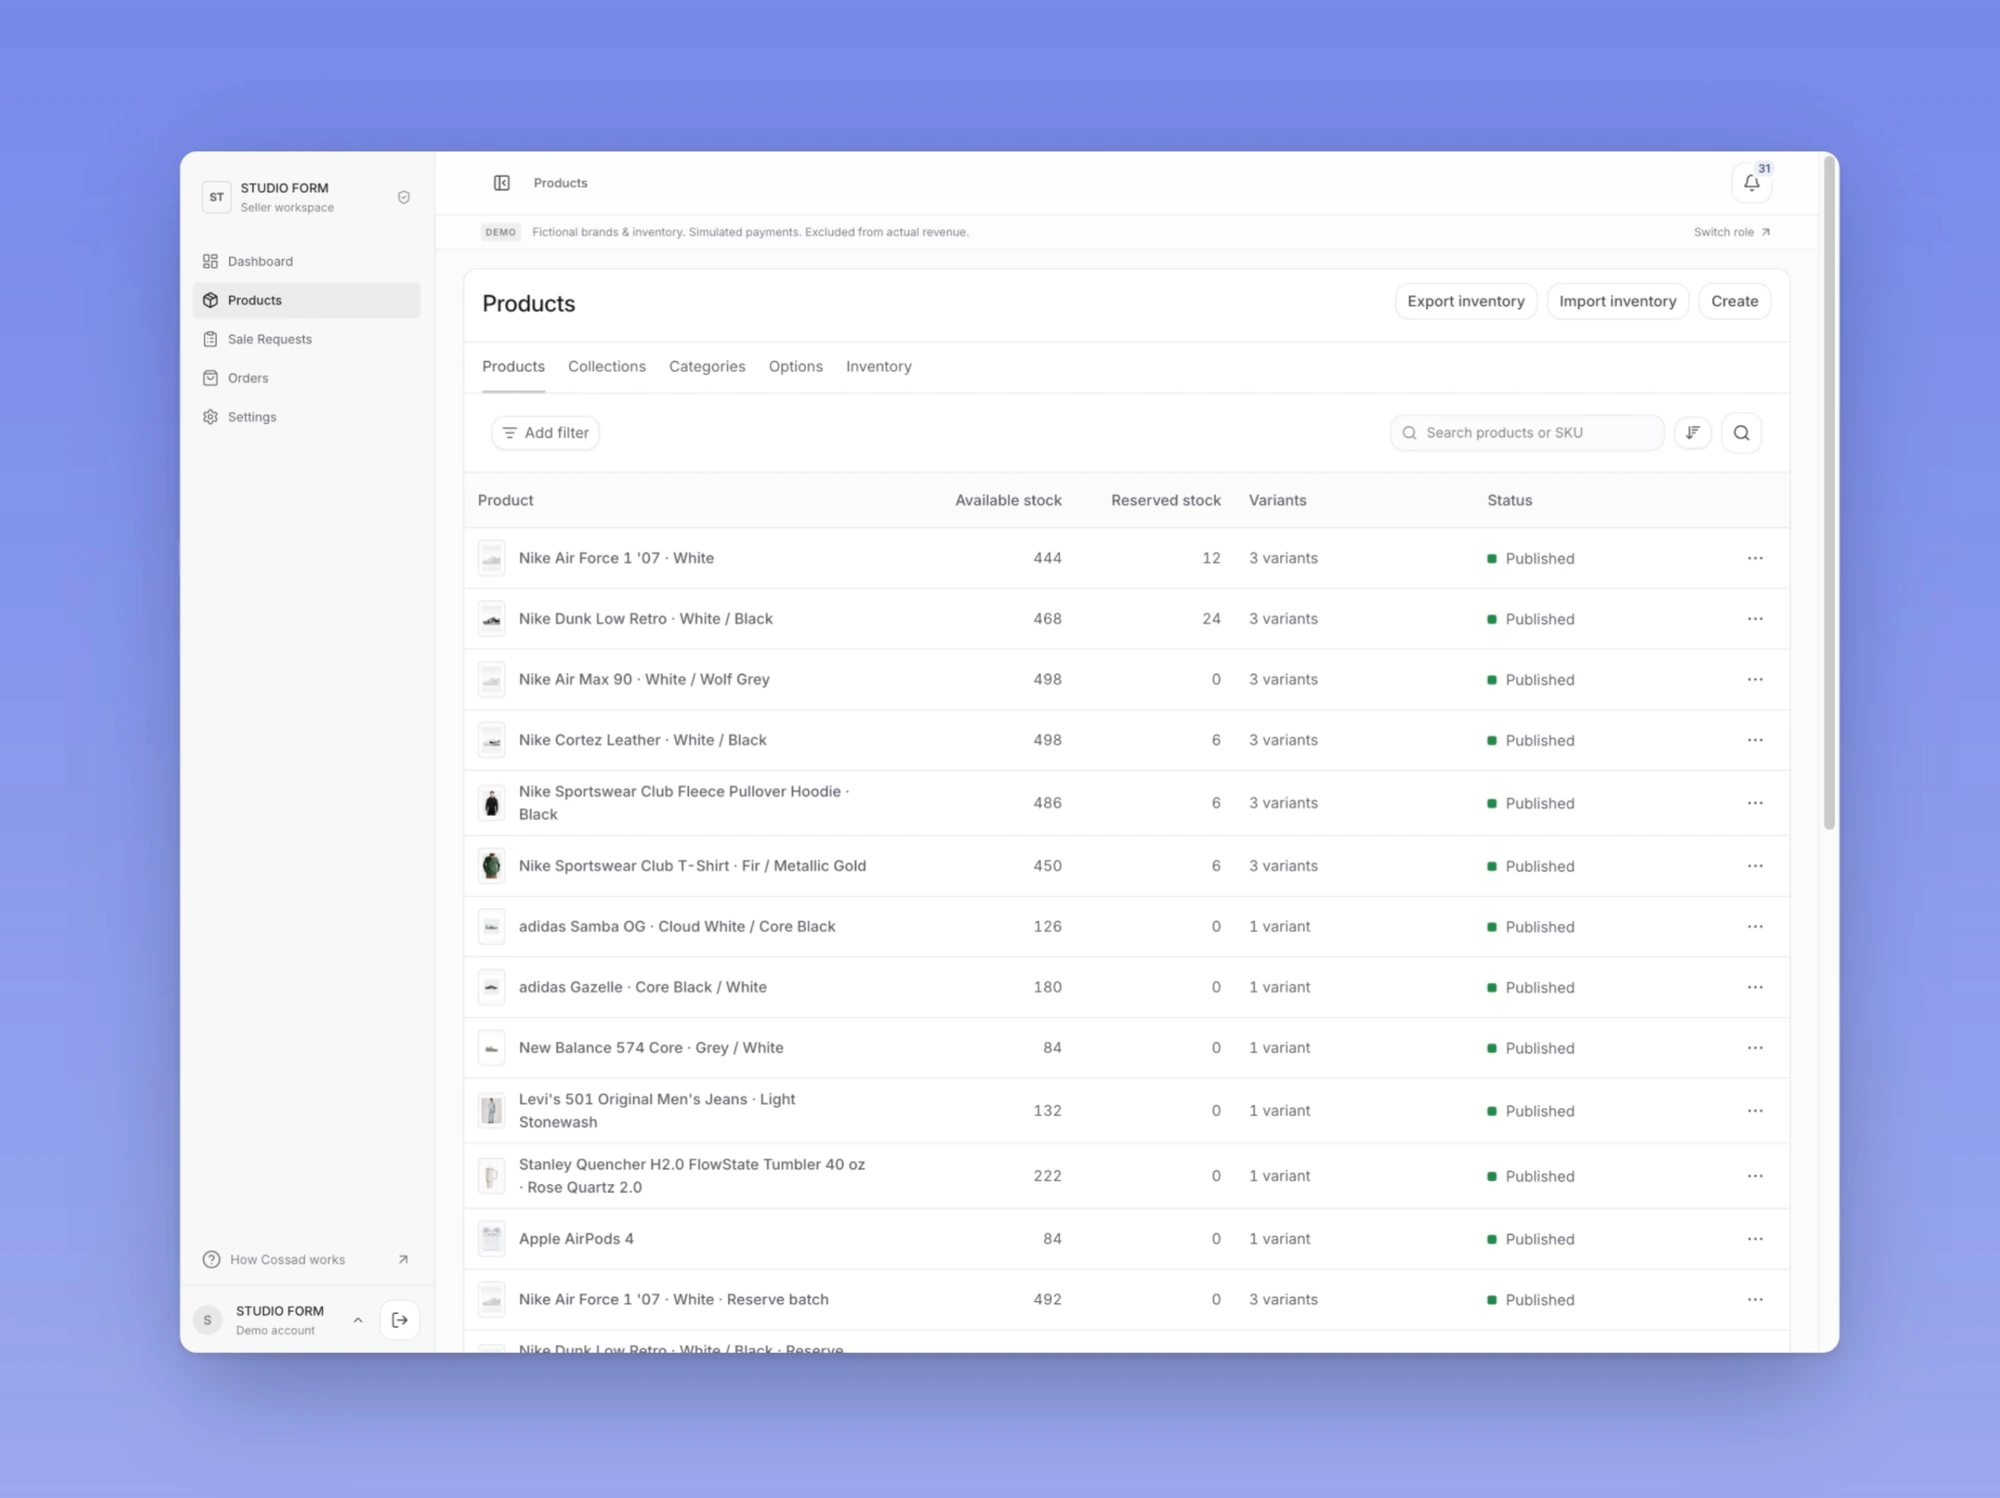
  • Cossad demo seller Products with sample merchandise, available stock, variants and publication status
    02 / Products

    Keep your products in order.

    Bring product photos, variants, available quantities and publication status together in one catalog.
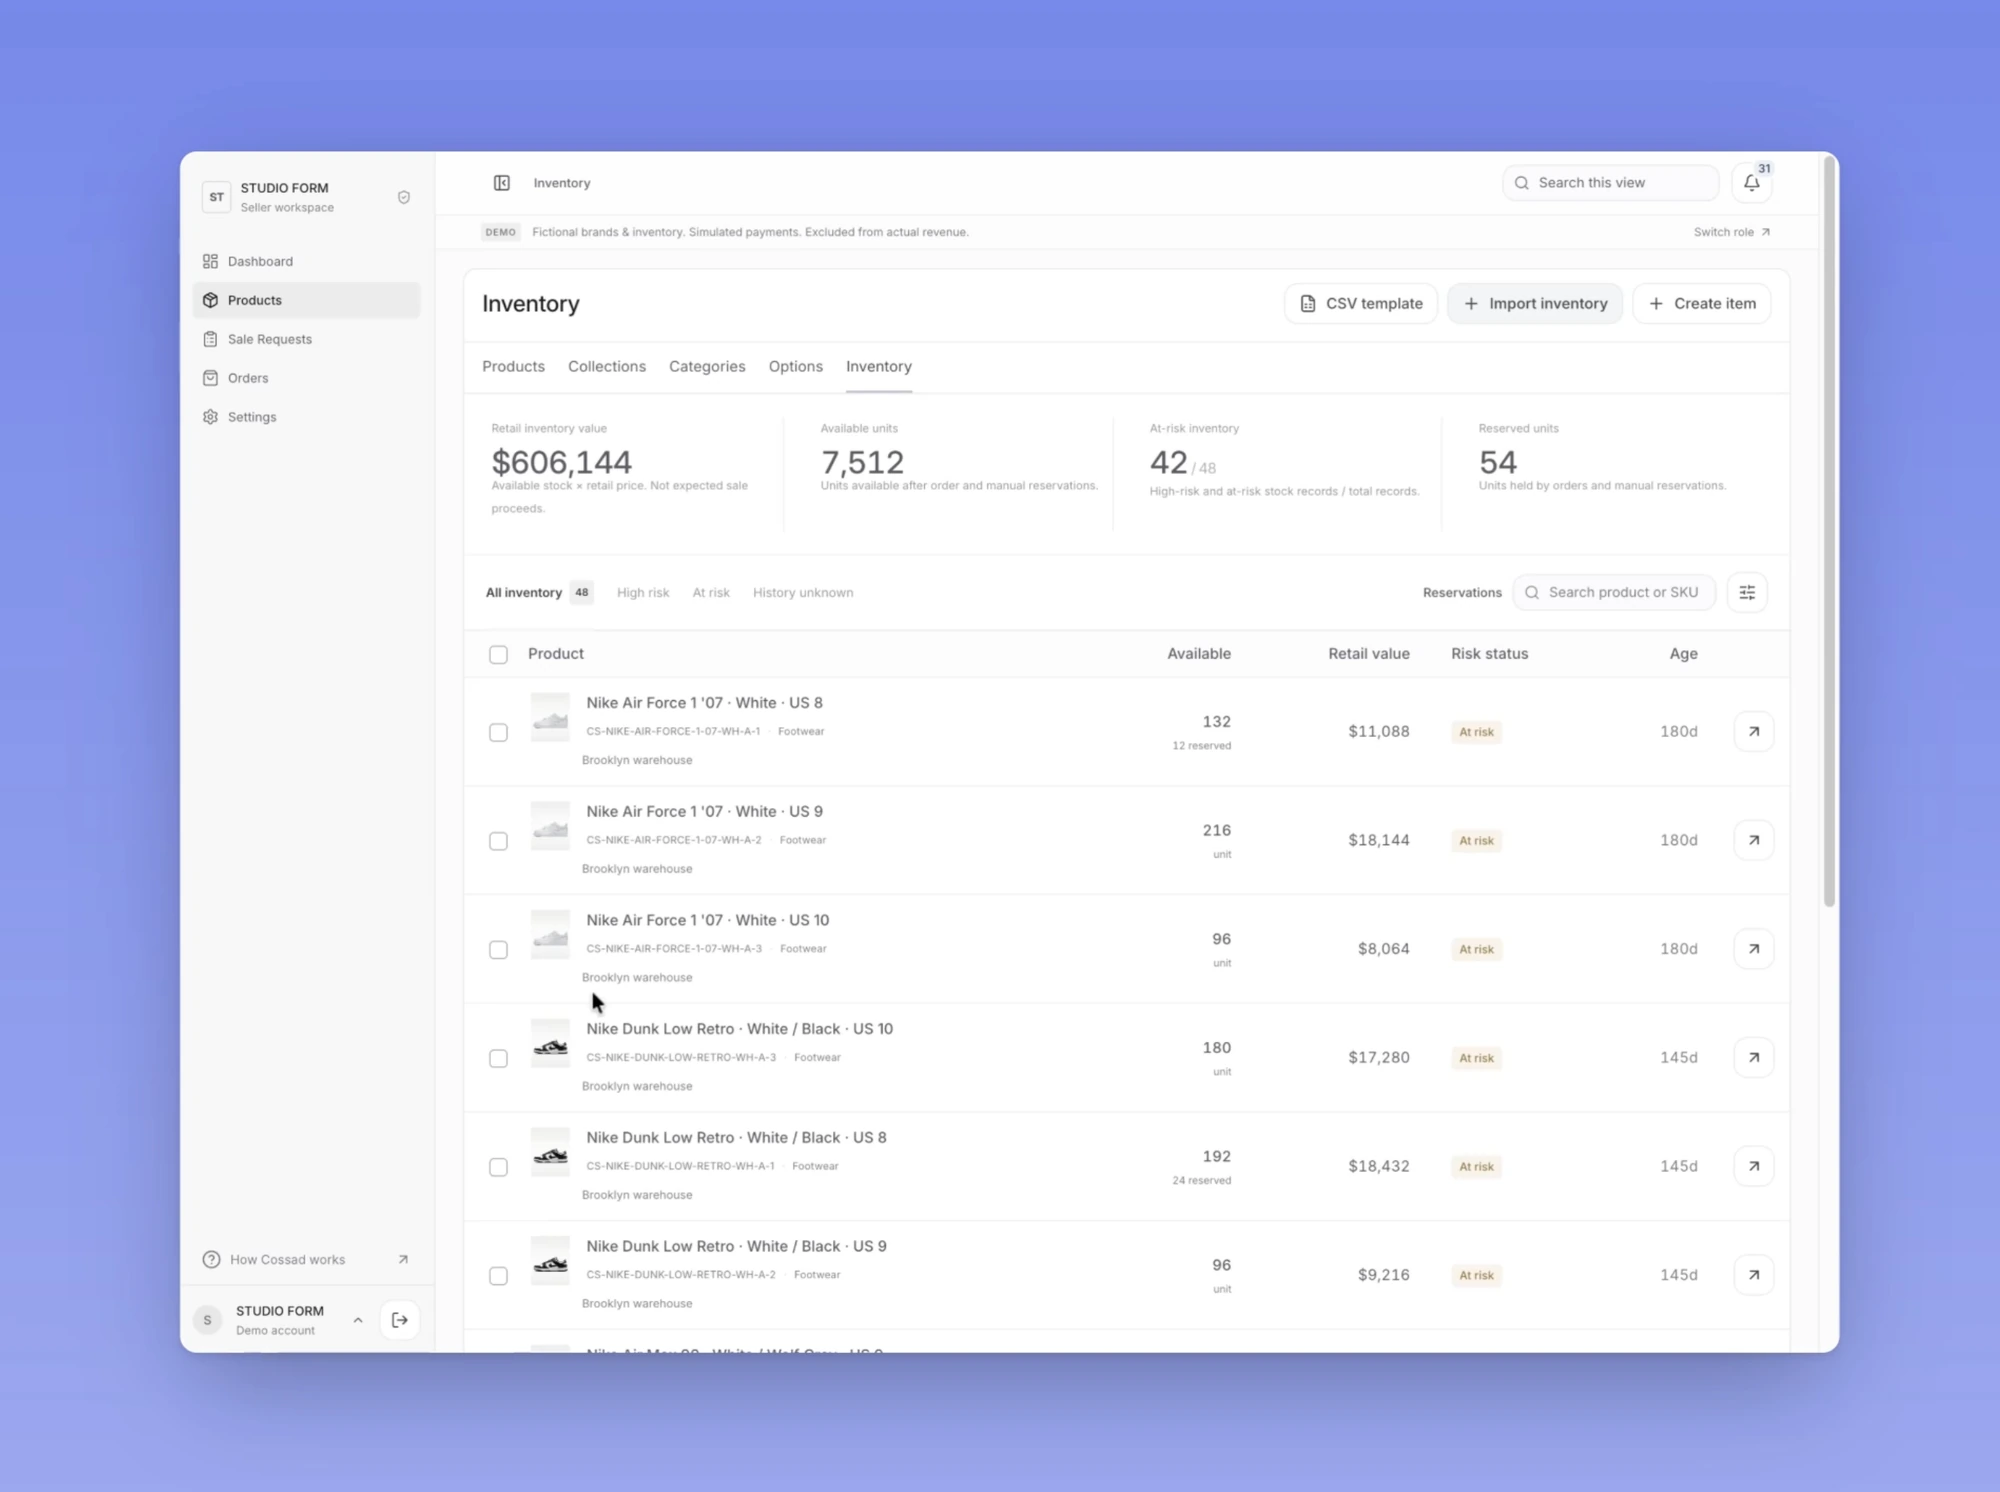
  • Cossad demo seller Inventory showing sample products, available stock and inventory status
    03 / Inventory

    Know what’s ready to sell.

    Keep product photos, available quantities and stock details together before offering inventory to buyers.
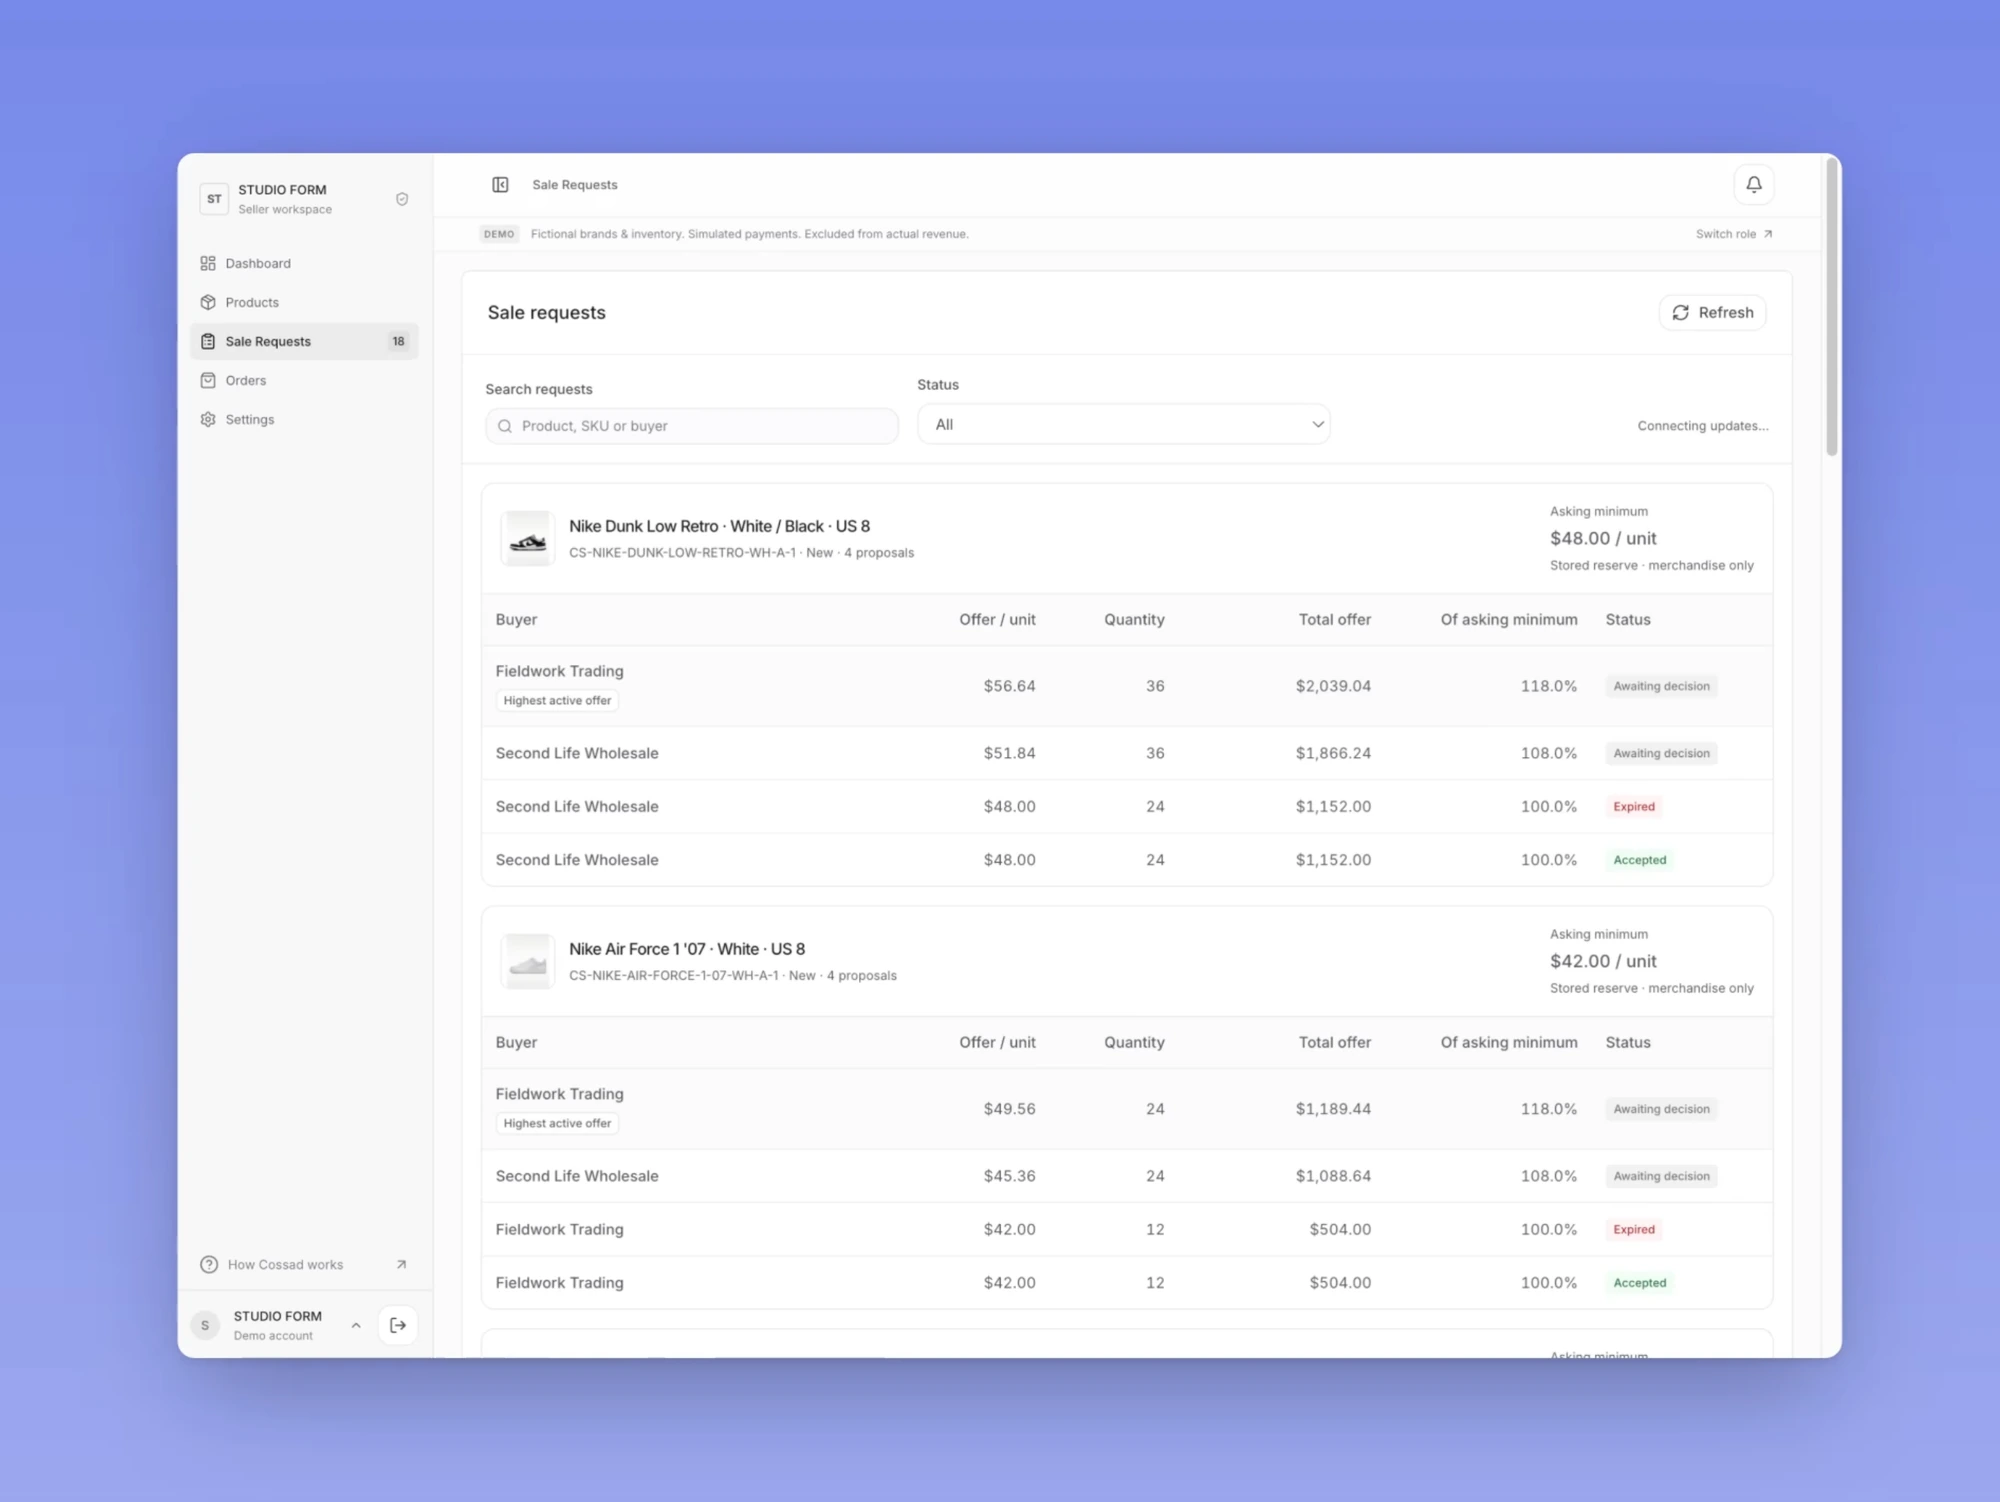
  • Cossad demo seller Sale Requests comparing fictional buyer offers for the same inventory
    04 / Buyer offers

    Find the offer that works for you.

    Compare buyer prices, quantities and handover terms. Accept, counter or decline from the offer details.

Actual Cossad demo screens · Illustrative charts, fictional inventory and transactions.

From inventory to
the right offer.

See what you have. Review the terms. Choose your next move.

Interactive example · Sample product imagery and offers.No orders, payments or messages are created.

What is waiting costing you?

Unsold stock ties up cash. Keeping it longer adds up.
See what another few months could mean for your business.

Try it with your stock value
Keep it for another

Use inventory cost, not retail price. 20% is an example, not an industry average.

6-month illustrative holding cost: $5,000. Separate annual 8% stock-value illustration: $4,000.
The cost of keeping it

$5,000

Illustrative holding cost over 6 months at 20% a year.

10–35% annual industry range: $2,500–$8,750 over 6 months.

Costs build while stock stays.6-month example
Illustrative holding cost over 6 monthsAt the selected 20 percent annual rate, illustrative holding costs grow evenly from zero to $5,000 over 6 months. The shaded industry-dependent 10 to 35 percent annual range ends at $2,500 to $8,750. Assumes unchanged stock value and rates. Not measured costs or a forecast.
Simple accrual with unchanged stock value. Includes capital, storage and other carrying costs, not just warehouse rent.
ASCM Supply Chain Dictionary, 18th edition, 2024. Industry-dependent annual range.
Some stock never gets sold.

~8%

Average annual stock waste reported in a five-sector study.

Stock can perish or be discarded while cash remains tied up.

Small percentages. Real scale.One-year reference
Approximately 8 percent reported annual stock wasteThe 2022 five-sector study surveyed 318 businesses, which reported approximately 8 percent of stock perished or was discarded annually. Applying 8 percent to the entered stock value gives $4,000 for scale only. This is an annual reference regardless of the selected holding period, not your forecast loss or a count of physical items.~8%reported waste
8% of your entered value$4,000Annual scale illustration
Applying the study percentage for scale, not predicting your loss. This annual reference does not change with the holding period.
Avery Dennison, The Missing Billions, 2022. Reported business estimates across five industries.

Make the next move

Good stock deserves
another opportunity.

Join as a buyerCreate a seller account

Business and seller eligibility review required.